


Supplemental Data to Antigen Recognition is Facilitated by Invadosome-Like Protrusions Formed by Memory/Effector T Cells J Immunology, 2012 ref. All Detailed Descriptions
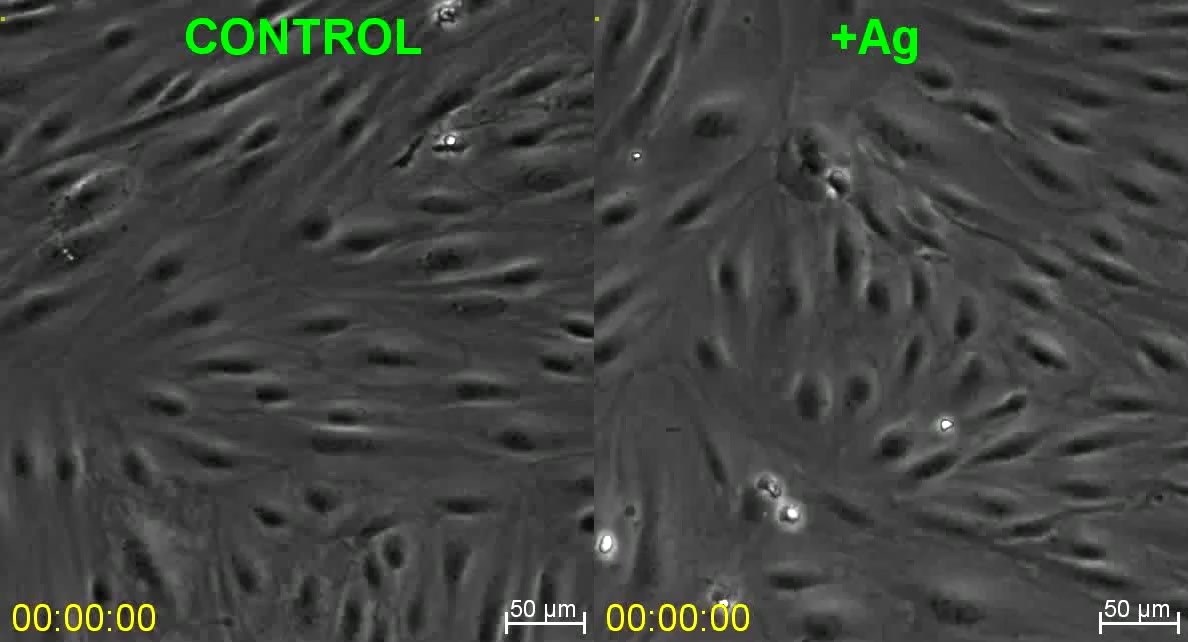
Video 1: ITmem CD4 T Cells Transiently Arrest Migration Under Shear Flow in Response to Ag.
Detailed Description
Video depicts iTmem (model primary effector/memory T cells) CD4 T cells interacting with IFN-gamma/TNF-alpha-activated HLMVEC under 2 dyne/cm2 laminar fluid shear flow in the absence (Control, left) and presence (+Ag; right) of pulsed TSST/SEB and corresponds to Fig. 1E. Cells were infused at 1 million/ml for 30 seconds. Video is 10 frames per second. Scale bar represents 50 um.
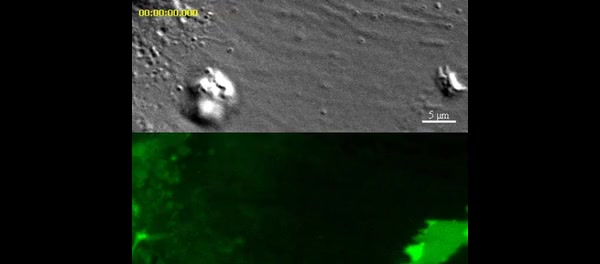
Video 2: ITmem CD4 T Cells Probe the Endothelium with Dynamic ILPs.
Detailed Description
Video depicts an iTmem CD4 T cell probing IFN-gamma/TNF-alpha-activated and mem-YFP transfected HLMVEC with dynamic ILPs and corresponds to Fig. 2A. Upper panels show DIC and lower panels show mem-YFP. Individual fluorescent rings (i.e., podo-prints) form and disappear continuously as lymphocytes laterally migrate over the endothelium reflecting dynamic probing by rapid insertion and retraction of T cell ILPs. Video is 5 frames per second. Scale bar represents 5 um.
Video 3: ITmem ILPs Become Stabilized and Form Dense Peripheral Arrays on Ag Presenting Endothelium.
Detailed Description
Video depicts an iTmem CD4 T cell interacting with IFN-gamma/TNF-alpha-activated, Ag-pulsed and mem-YFP transfected HLMVEC and corresponds to Fig. 2B Ag Example 1. Upper panels show DIC and lower panels show mem-YFP. As seen by DIC two lymphocytes exhibit different degrees of spreading without significant polarization or lateral migration. At the same time several initial podo-prints are seen to form on the endothelium that rapidly transition to dense arrays of ILPs predominantly localized to the peripheral/lamellipodial zone of the T cell-EC contact. Once formed most individual ILPs persist throughout the duration of the video (15 min) during which time they exhibit limited shape change and lateral translocation. Toward the end of the video some podo-prints shrink and/or disappear, suggesting retraction of ILPs. Other ILPs apparently begin to drive formation of trans-cellular pores in the endothelium as noted by the black spots that appear where podo-prints were formerly located. Video is 5 frames per second. Scale bar represents 5 um.
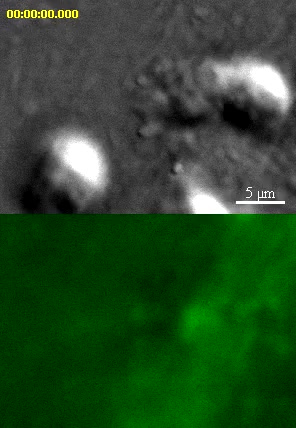
Video 4: A Minority of ITmem Form Rosette Type Arrays of Stabilized ILPs on Ag Presenting Endothelium.
Detailed Description
Video depicts an iTmem CD4 T cell interacting with IFN-gamma/TNF-alpha-activated, Ag-pulsed and mem-YFP transfected HLMVEC and corresponds to Fig. 2B Ag Example 2. Upper panels show DIC and lower panels show mem-DsRed. As seen by DIC a lymphocyte spreads a symmetrical ruffle without lateral migration. As seen on EC mem-DsRed, several initial podo-prints are seen to form on the endothelium that rapidly transition to a dense peripheral array localized to the T cell lamellipodial zone. Subsequent addition of more central podo-prints then leads to rosette type clusters by ~10 min. Once formed most individual ILPs persist throughout the duration of the video (45 min) during which time they exhibit limited shape change and lateral translocation. Toward the end of the video some podo-prints shrink and/or disappear, suggesting retraction of ILPs. Other ILPs apparently begin to drive formation of trans-cellular pores in the endothelium as noted by the black spots that appear where podo-prints were formerly located. Video is 5 frames per second. Scale bar represents 5 um.
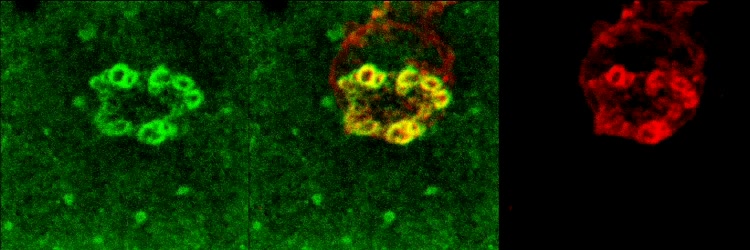
Video 5: Ag Stabilized ILPs are Enriched in Integrin LFA-1 and Podo-prints Enriched in ICAM-1
Detailed Description
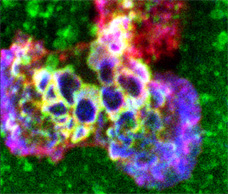
Video depicts 3D rotation of ILP arrays formed by iTmem bound for 5 min to activated HUVEC, pulsed with Ag (SEE) and corresponds to Fig. 3B. Samples were stained for ICAM-1 (green) and LFA-1 (red) and subjected to serial-section (0.3 um thickness) confocal imaging followed by digital reconstruction. To enhance the visualization of the ILP architecture, as a series of 30 three-dimensional projections were rendered, each representing successive rotation about both the x and z axis in 3 degree intervals for a total of 90 degrees about each axis, and played in series. Note that individual ILPs can clearly be seen to form LFA-1-enriched three-dimensional, cylindrically-shaped, micron-scale protrusions, whereas podo-prints are clearly the cognate 3D ICAM-1-enriched endothelial invaginations into which the ILPs extend.
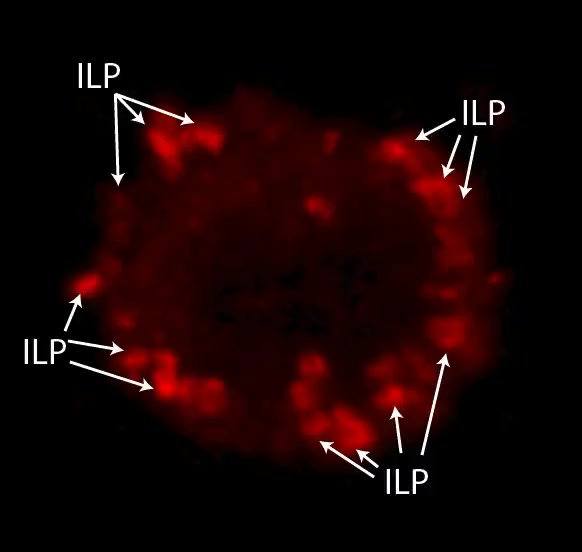
Video 6:Ag-Stabilized ILP Arrays are Highly Enriched in HS1.
Detailed Description
Video depicts 3D rotation of HS1 (red) enriched ILP arrays formed by iTmem bound to activated, Ag-pulsed HLMVECs for 5 min and corresponds to Fig. 4H. Samples were subjected to serial-section (0.3 um z-step) confocal imaging. Images were digitally reconstructed and rendered as a series of 3D-projections with progressive rotations about the x, y and z axes to enhance the visualization of architectural details. Note that HS1 is highly enriched into three-dimensional, cylindrically-shaped, micron-scale lymphocyte projections arranged as dense arrays at the periphery of the T cell-EC contact area.
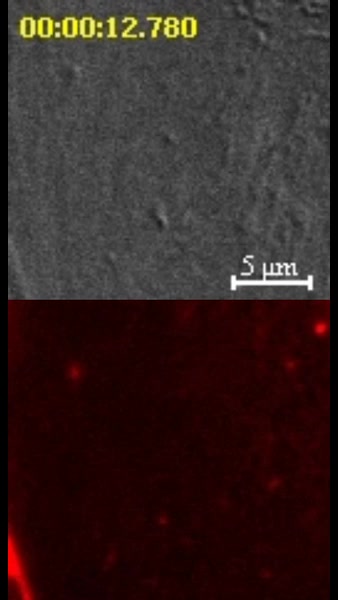
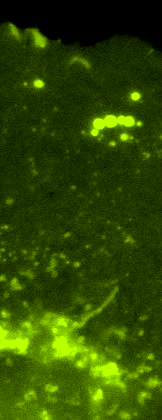
Video 7: ILPs Precede and are Stabilized by Ag-Dependent Calcium Flux.
Detailed Description
Video depicts Fura-2-labeled iTmem CD4 interacting with mem-DsRed-transfected, activated and Ag-pulsed HLMVECs and corresponds to Fig. 5A. Note that a single central podo-print/ILP initially forms (time stamp = 00:00 min:sec) and precedes initiation of calcium flux by 20 seconds (offset time = 20 sec). By approximately 1 min after initial podo-print/ILP peak calcium flux is established commensurate with transition to peripheral arrays of stabilized podo-prints/ILPs. These arrays persist over the duration of the video, but individual ILPs become less well-defined (and in this particular example undergo limited centripetal translocation as calcium signal begins to decay. Video is 5 frames per second. Scale bar represents 2 um.
Video 8: OT-I CTL T Cells Probe the Endothelium with Dynamic ILPs.
Detailed Description
Video depicts an OT-I CTL probing IFN-gamma/TNF-alpha-activated and mem-YFP transfected murine heart MVEC with dynamic ILPs and corresponds to Fig. 7C. A. Left panel show DIC, right panel show mem-YFP. Note that the CTL avidly probes the endothelial surface by constant formation and retraction of clusters of ILPs (evidenced by micron-scale fluorescent rings, i.e., podo-prints) under the leading edge lamellipodia. Here in the absence of cognate Ag, lateral migration and rapid ILP turnover (~20 sec lifetime) persist. Video is 5 frames per second. Scale bar represents 5 um.
Video 9: Dynamics of Initial and Peripheral Arrays of T cell Micro-Contacts during Interaction with Anti-CD3-Coated Glass.
Detailed Description
Video depicts 3 sequential examples of iTmem CD4 T cells interacting with ICAM-1-/anti-CD3-coated glass. Example 1 corresponds to Fig. S4E. Note that in each example cells initially form a few IRM-resolved micro-contacts (i.e., dark spots), followed by rapid spreading of symmetrical lamellipodia under which arrays of micro-contacts continue to form. Video is 10 frames per second. Scale bar represents 5 um.
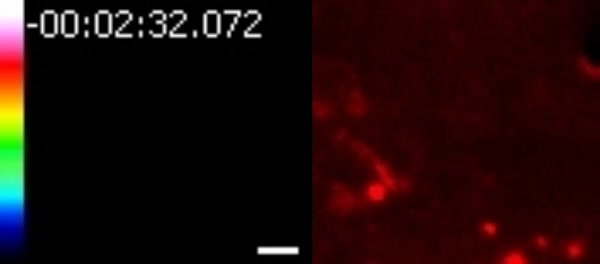
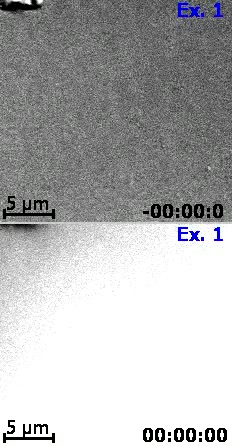
Video 10: T cells form 3D ILPs on anti-CD3-Coated CHO-K1 Cells.
Detailed Description
Video depicts Fura-2 labeled iTmem cells interacting with a planar cell-coated APC model and corresponds to Fig. 8D. CHO-K1 cells were transfected to express cell-surface ICAM-1-GFP (green) and intracellular soluble DsRed (red) and then with coated anti-CD3 antibody using a cell surface biotinylation/streptavidin capture approach. Note the clear appearance of ICAM-1-GFP fluorescent rings and correlating circular regions of displaced sDsRed indicating CHO-K1 cell surface invagination that precede initial calcium flux by several frames (i.e., offset time 56 + 17 sec). Arrays of clustered, rosette-type arrays form commensurate with increased calcium flux. Video is 10 frames per second. Scale bar represents 5 um.
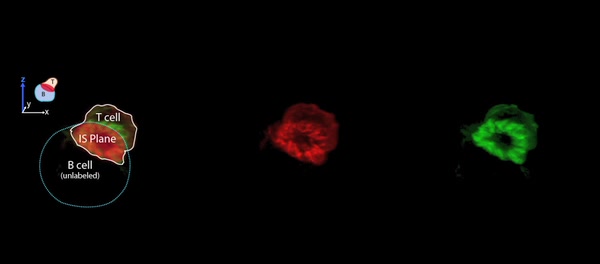
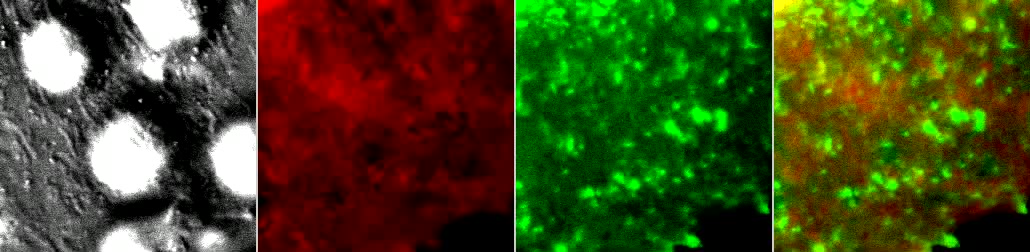
Video 11: ITmem Cells Form ILPs during Initial Interaction with Ag-Pulsed Priess B Cells.
Detailed Description
Priess B cells were allowed to adhere to coverglass coated with anti-CD20 and then pulsed with antigen as described in Experimental Procedures. ITmem cells were added to the wells and incubated for 5 min before samples were fixed and stained for F-actin (green) and LFA-1 (red). Confocal images were acquired and 3D digital reconstructions rendered. Movie represents one such reconstruction (corresponding to Fig. 8G) where the T cell (white outline) settled on top of the B cell (blue dashed line) fortuitously forming quasi en face IS (red overlay), which is rotated about the z-axis over time. Peripheral lymphocyte ILPs rich in LFA-1 and F-actin are clearly evident T cell-B cell contact zone.
“Video for Everybody” v0.3 by Kroc Camen camen design